Last Updated on January 10, 2023 9:56 am
Intro
January 10, 2023
For the most part when it comes to technology you get what you pay for. But that doesn’t stop many from trying to find a great bargain. SSD prices have been dropping pretty aggressively over the last year. 2TB drives can frequently be found for under $100, but how good are they? As you can see from a previous review of a 2TB 2.5″ Leven SSD that can be had for under $100 doesn’t really fit the bill. It performs well within the first 25% of the drive but then falls flat for the rest.
Sometimes having a DRAM cache or even a small SLC cache can help though. Unfortunately most manufacturers of these inexpensive SSD’s aren’t very forthcoming with specs. The Acer SA100 NVMe 2TB SSD is no different. Acer is a known brand name for making PC’s for decades now. Apparently they offer components for sale to consumers now too.
Physical / Specs
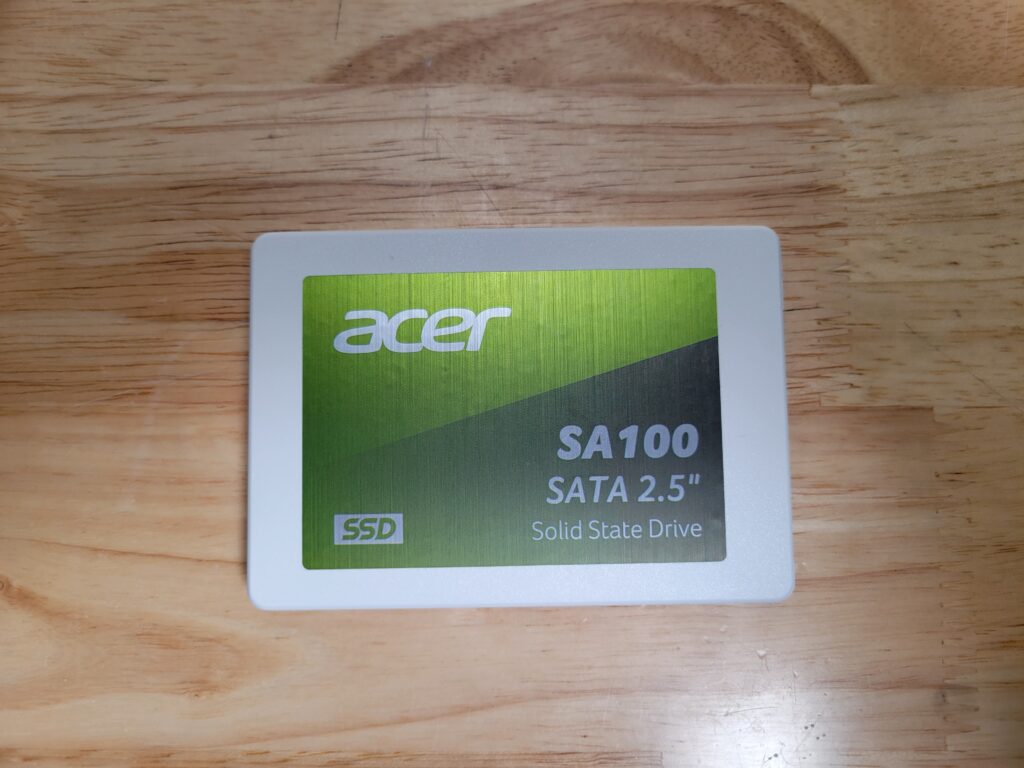
The device being tested was purchased from Amazon.com (USA) for $89 USD as new. It comes in a cardboard box and that’s about the extent of the packaging. The SSD itself comes in a plastic white shell with an Acer green sticker.
Specs page is listed here: Acer SA100 SATA lll SSD, up to 1.92 TB, 3D NAND flash memory IC (acerstorage.com)
Here’s a brief rundown of the specs:
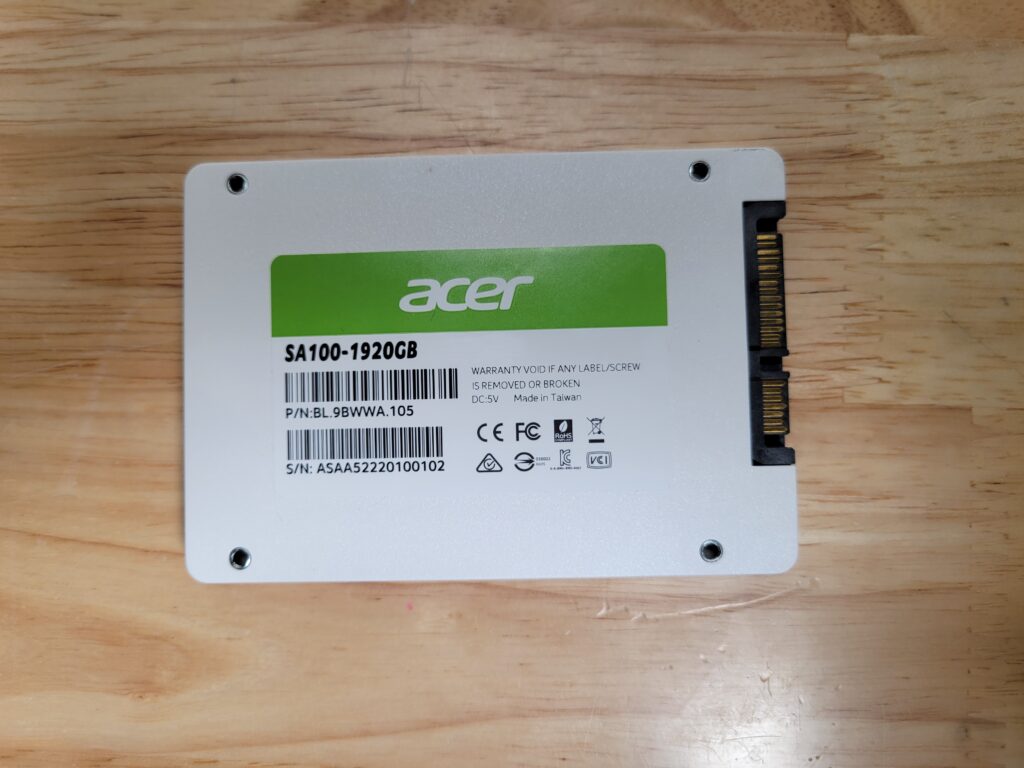
* Capacity: 1.92TB
* Sequential Read: 560 MB/sec
* Sequential Write: 508 MB/sec
* Random Read IOPS: 76K
* Random Write IOPS: 77K
* Idle Power: 0.19W
* Active Power: 1.97W
* Endurance / Warranty: 600TBW / 3 years
There is no mention about whether it is QLC, TLC, MLC or other type of NAND flash. It is most likely TLC or QLC as the pricing between the two are quite competitive at the moment. It is clear that there is no DRAM cache though, which is a bit of a bummer, but I guess that’s how they cut costs.
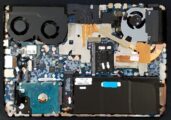
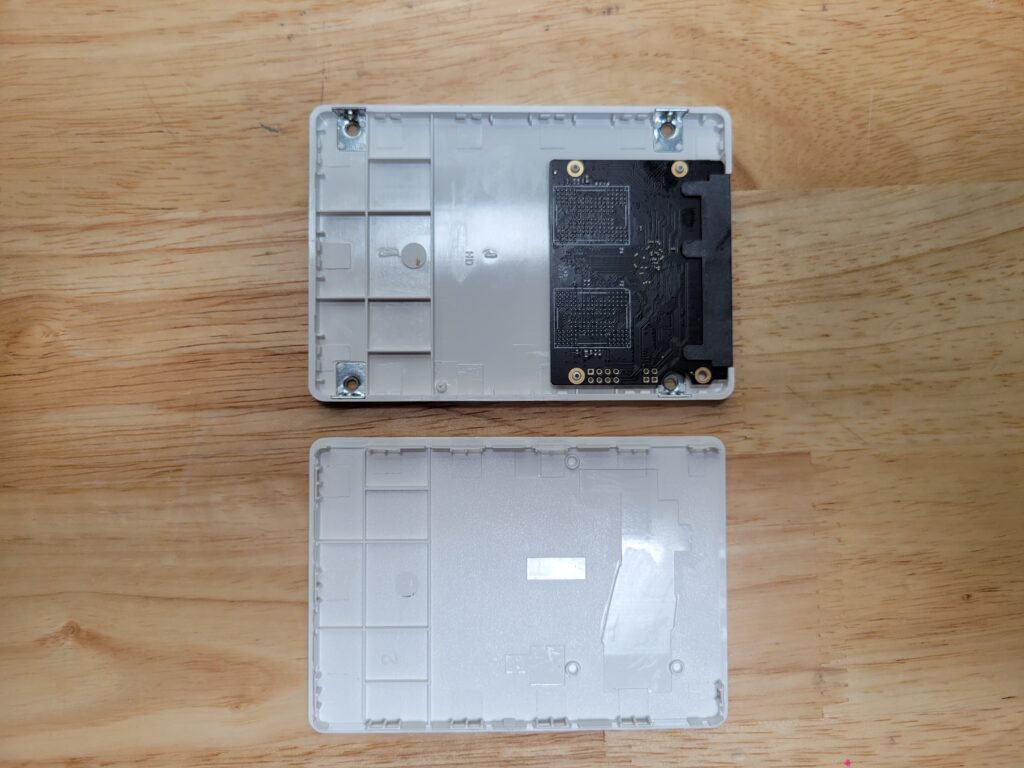
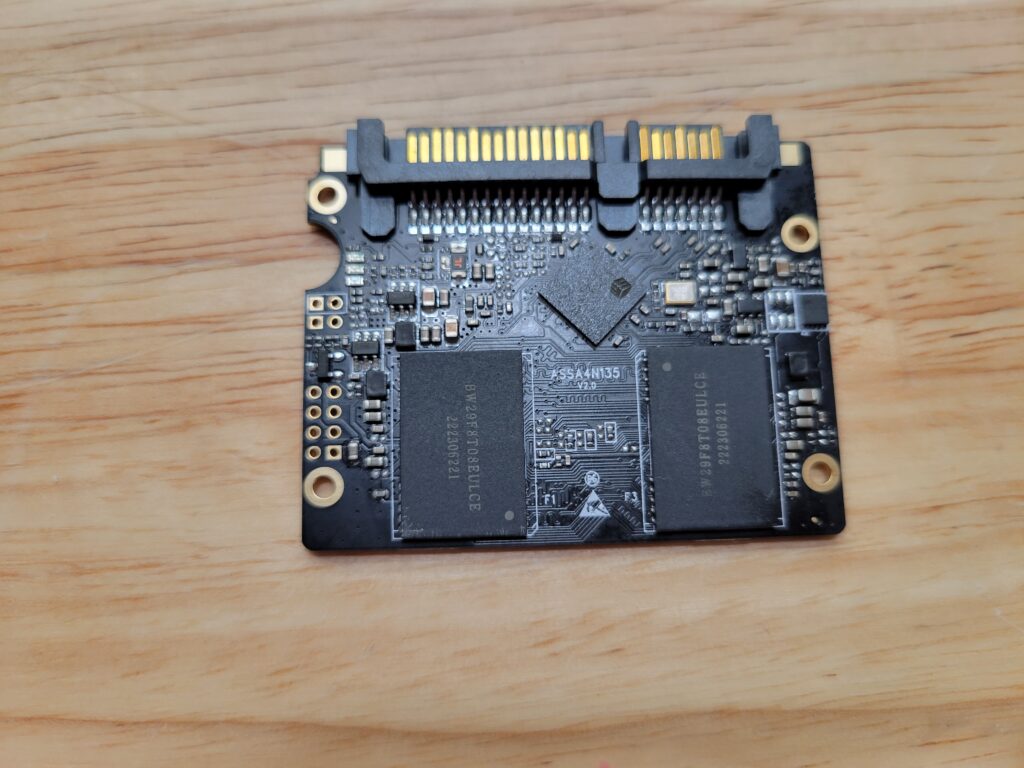
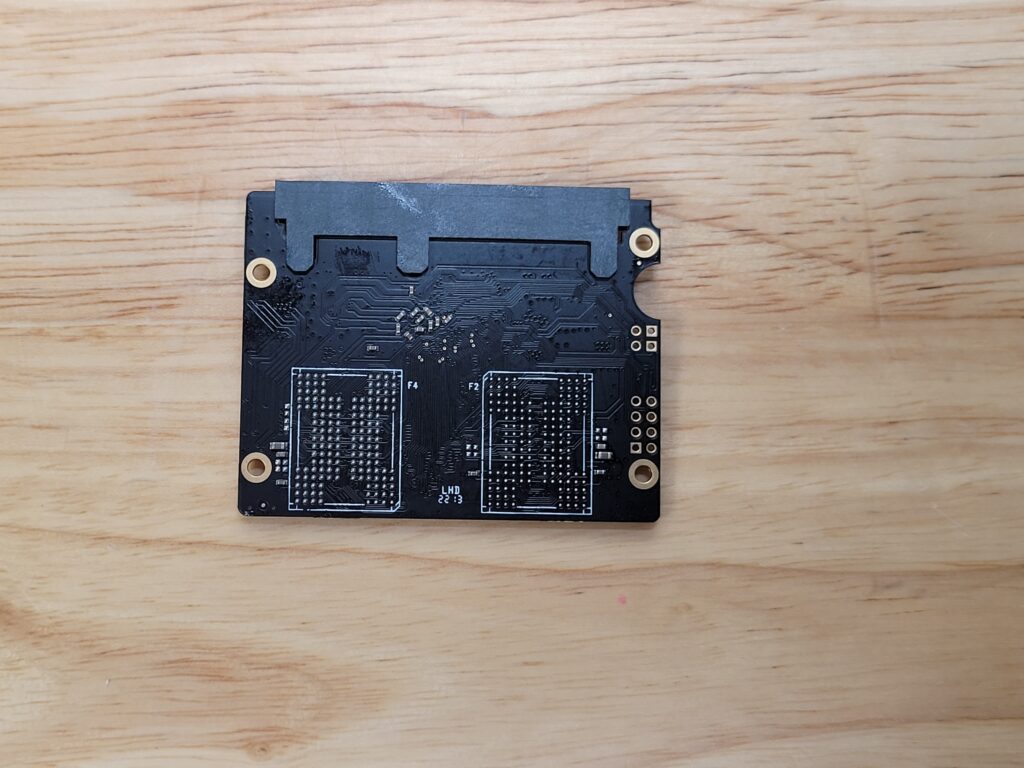
It’s possible to access the actual SSD PCB inside by prying open the case carefully. There are no fasteners to hold the PCB in place except the shell itself, it’s a simplistic design, which is ideal, no unnecessary fasteners. The PCB consumes only about 1/3 of the case, has two NAND chips and a SiliconMotion controller chip on board.
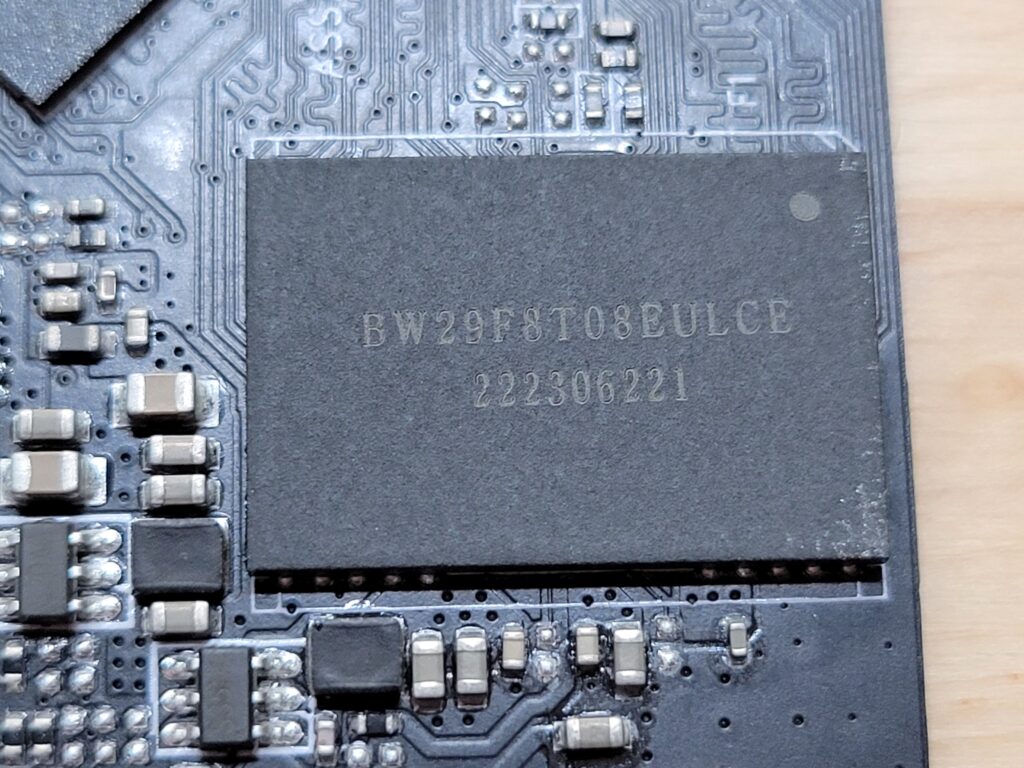
Having two NAND chips, obviously each is 1TB in capacity each. They have a part number etched on them but Google doesn’t come back with anything, so perhaps it’s just some generic NAND bulk purchased by Acer. The numbers on the NAND as shown in the photos are: BW29F8T08EULCE / 222306221. No specific logo or anything.
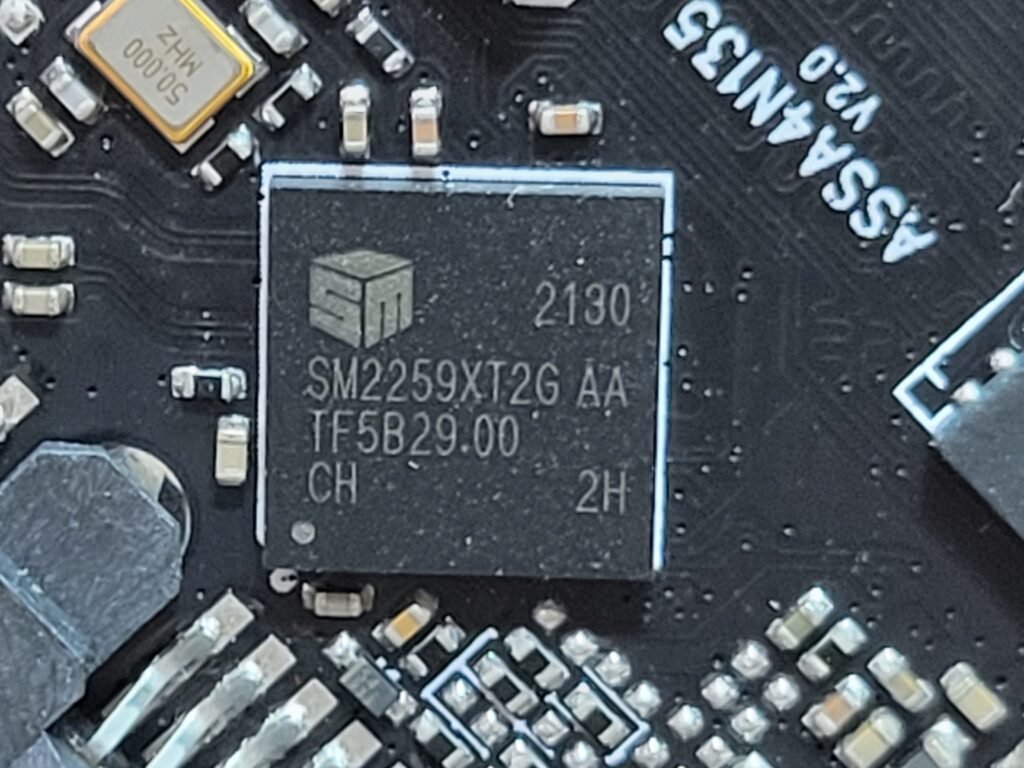
The controller chip is clearly marked as a SiliconMotion SM2259XT which SiliconMotion has a spec sheet for here: https://www.siliconmotion.com/download/q/a/SM2259_XT_PB_EN_201910.pdf.
It identifies it as a SATA 6Gbps / ATA-8 chip with 4 NAND flash channels and sequential read of 560 MB/sec and sequential write of 520 MB/sec and DRAM-less interface. There is no DRAM on this device, and clearly by viewing the PCB there is no DRAM chip present.
Performance
All tests were run using a Windows 10, Intel Core i3-10105, 32GB DDR4 3200MHz (dual channel), MSI 560M Pro motherboard.
Several performance test were run:
* CrystalDiskMark
* ATTO
* Hard Disk Sentinel Full Disk Read and Write
* Full disk copy script: 1GB, 10MB, Mixed File Sizes (1GB, 100MB, 10MB, 1MB)
These will all be tested against a Samsung 870 EVO 2TB for comparison.
CrystalDiskMark
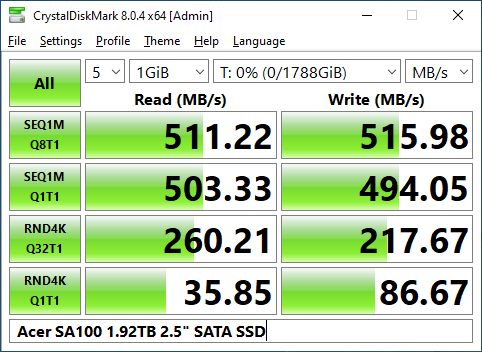
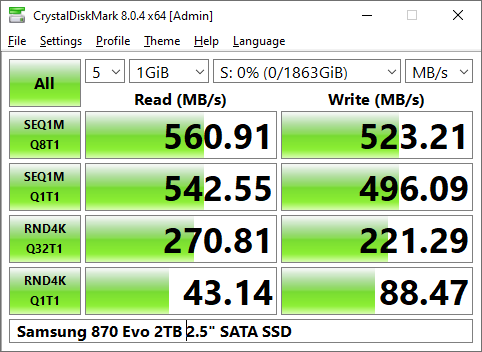
CrystalDiskMark is a good test for general performance. It doesn’t give the full picture but it’s a good way to see if it lives up to its marketing claims at least. Acer claims 560 MB/sec max sequential read speed and 500 MB/sec max sequential write speed. This shows Read speed is shy of that but write speed exceeds it. Overall specs look pretty impressive when compared with the Samsung 870 EVO.
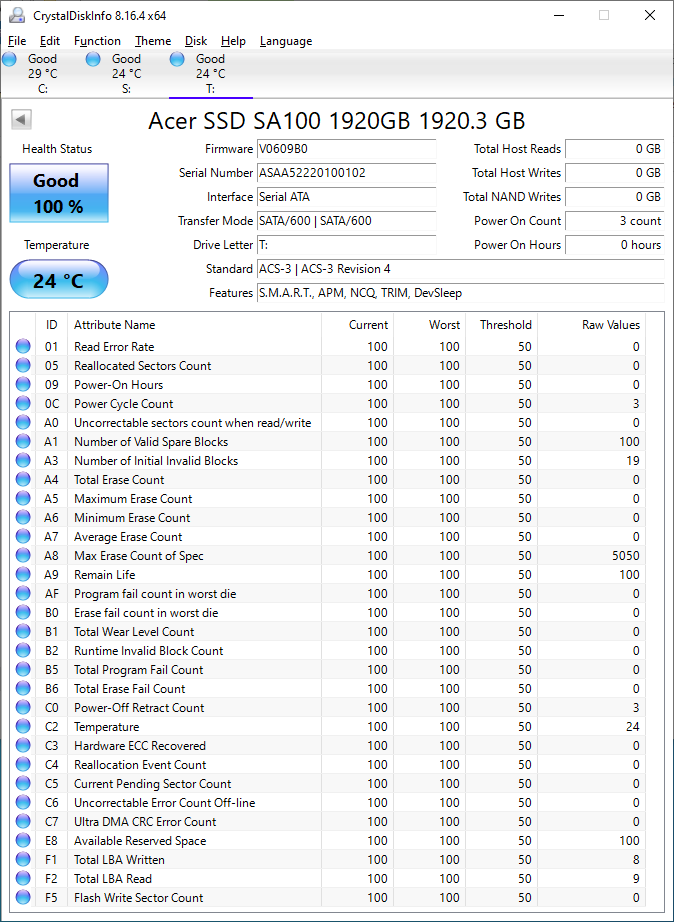
For reference here is the CrystalDiskInfo for the Acer SA100 2TB Drive:
ATTO
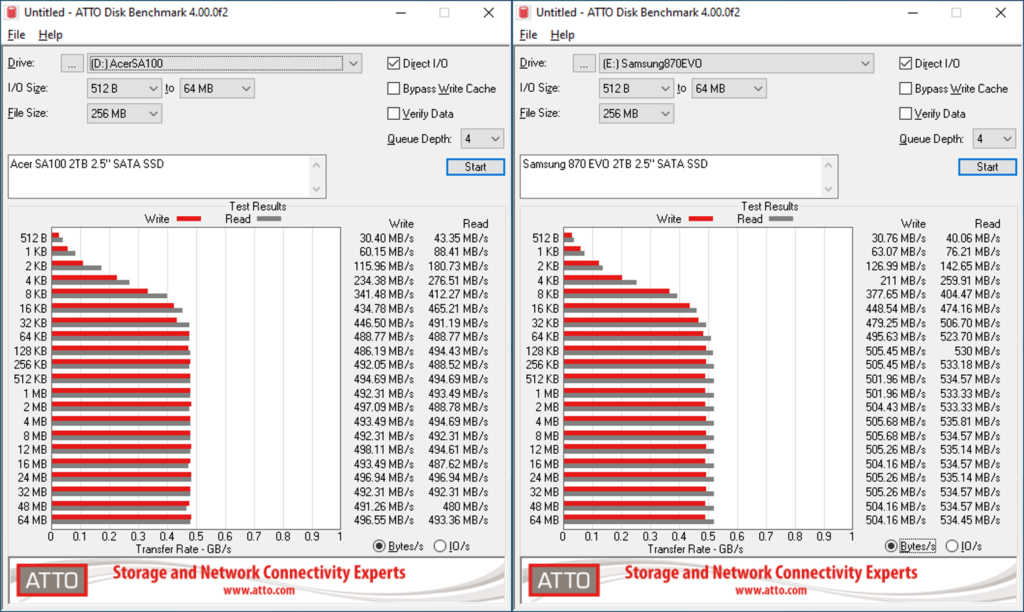
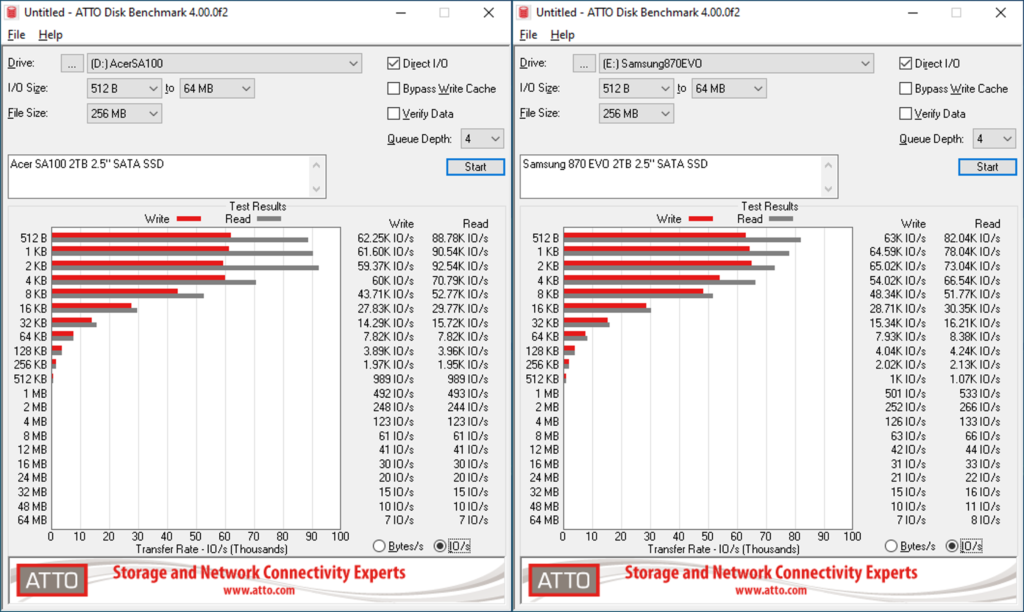
You can see from ATTO that the performance in both MB/sec and IOPS are similar between the Acer drive and the Samsung.
Hard Disk Sentinel
Hard Disk Sentinel offers the option for a full disk read and write test. By default it will write 0’s to every bit across the disk, so this is more like a streamed data test but it’s a good indicator of actual overall performance of the drive and NAND flash in particular.
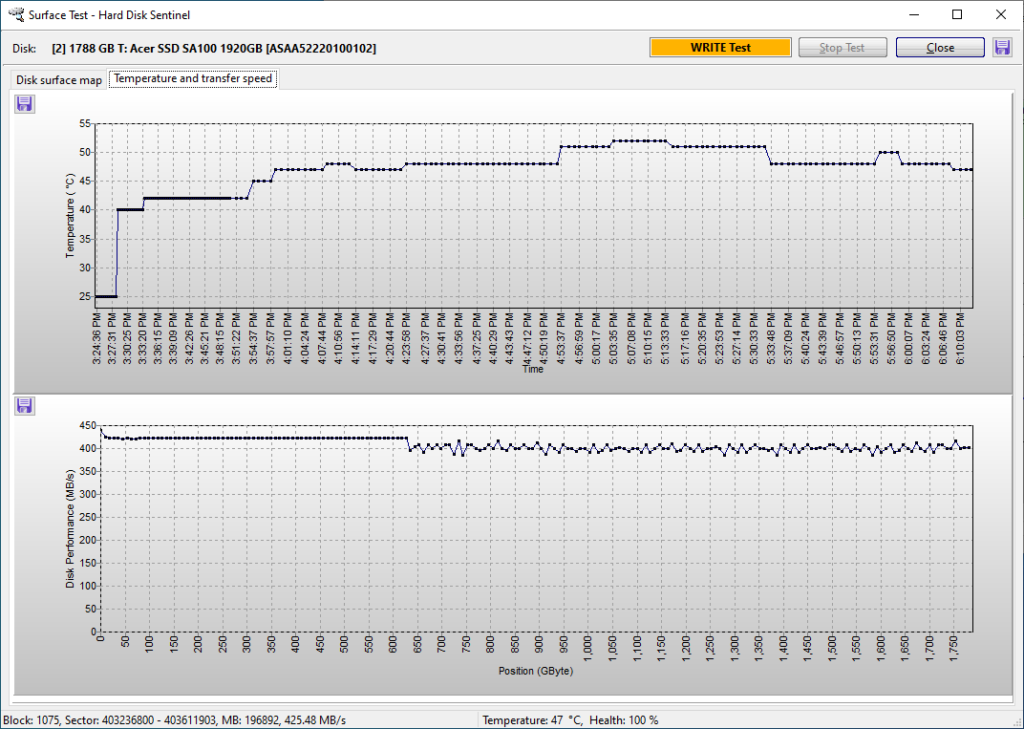
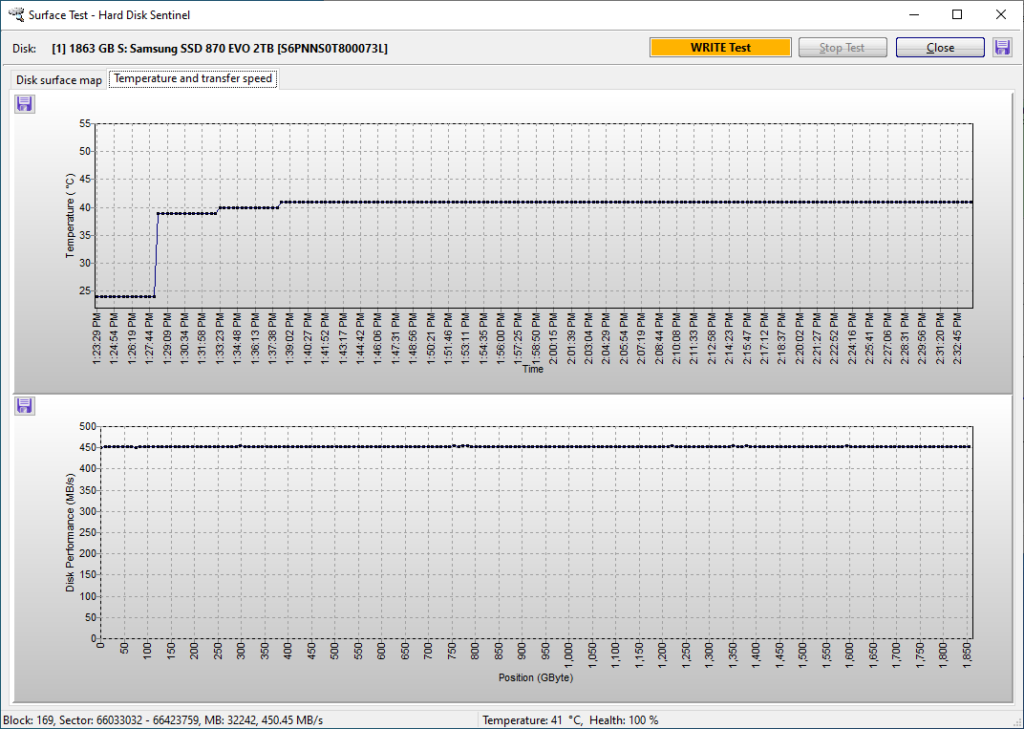
Hard Disk Sentinel – Full Disk Write:
If you graph the actual full dataset from this test and overlay Acer and Samsung SSD’s you get the following:
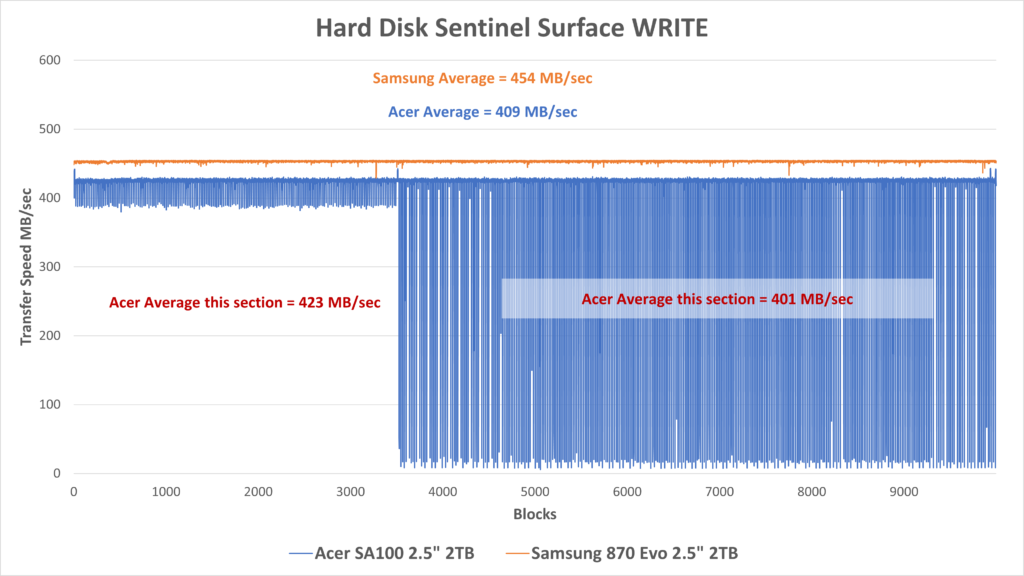
This disk was completely new when the test was performed so it should be at its best performance overall. You can see it actually fares pretty well across the entirety of the disk, although at about 600GB it tends to falter a bit. Compare that with the Samsung 870 EVO, that is solid across the entirety of the disk.
For whatever reason the Acer write speed dips down to the teens MB/sec periodically, but overall average isn’t affected too much.
This also gives us an insight into the peak temperatures of the SSD. During writes it peaks at about 52C, which is a bit toasty, but not too bad. Clearly the Samsung fares much better running about 10C cooler.
Hard Disk Sentinel – Full Disk Read:
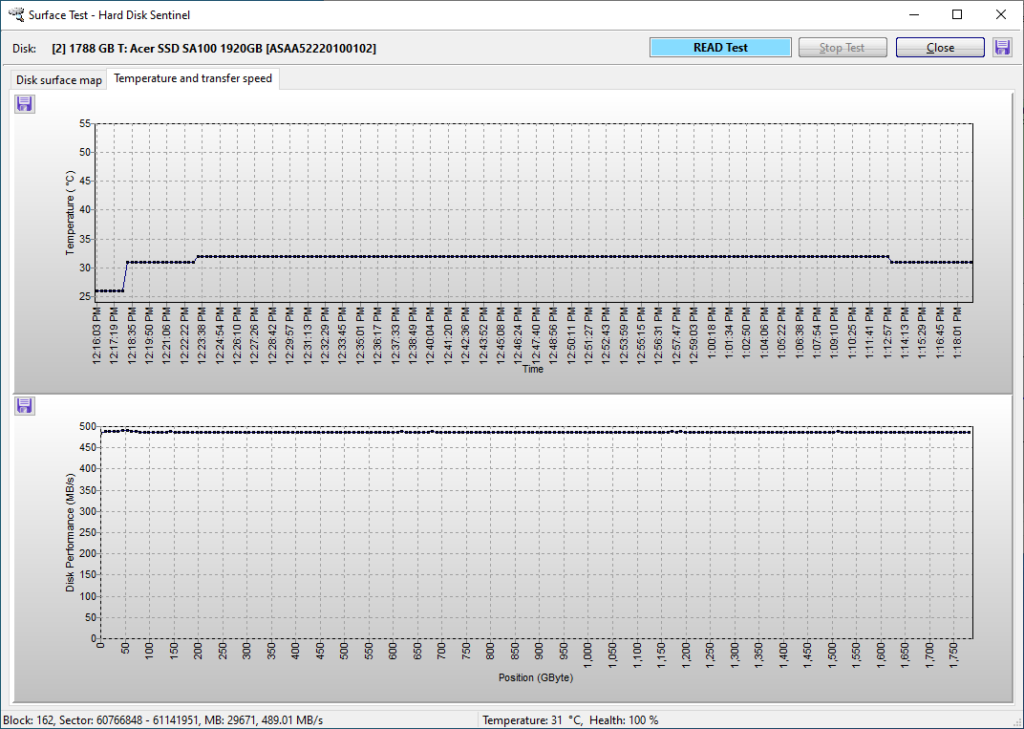
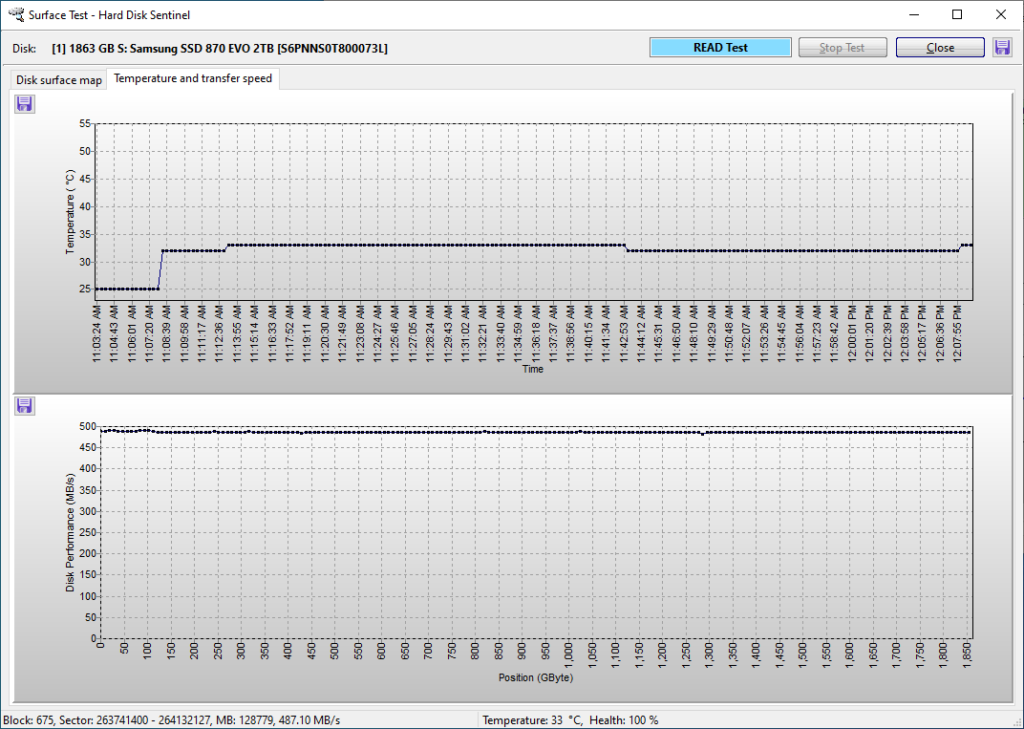
If you graph the actual full dataset from this READ test and overlay Acer and Samsung SSD’s you get the following:
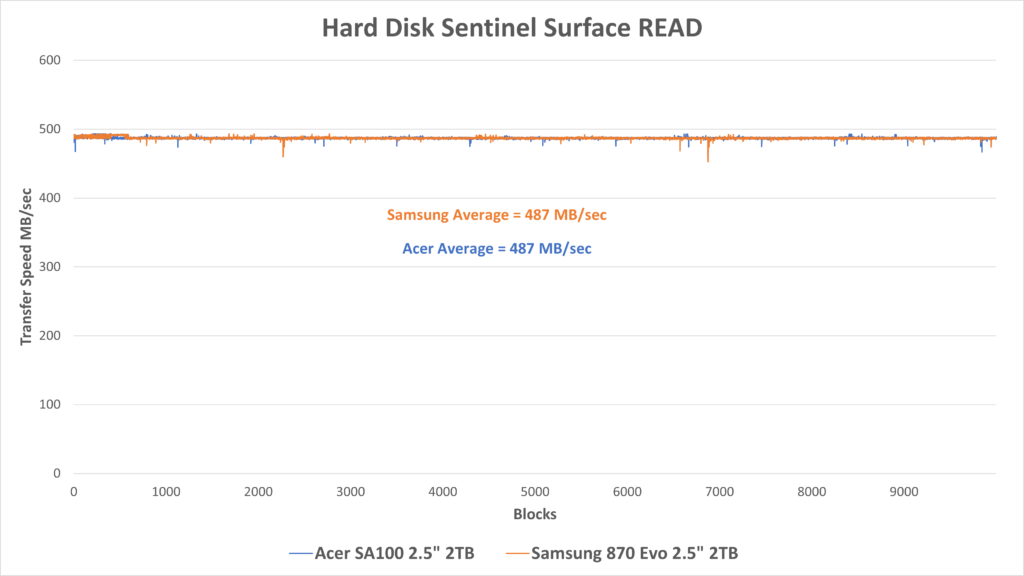
It is interesting to see that you can see that the Full Disk Read test is nearly identical between the two drives. Temperatures are reasonable as well at 32C throughout the test for the most part.
Powershell Full Disk Copy
This test is not a standardized test. It is one that I contrived. Basically it will write files filled with random data across the entirety of the disk using a powershell script copying files from a RAM disk to the the SSD. Also the files were also read back after the write test to the RAMdisk.
There are three tests run:
* 1GB files
* 10MB files
* Mix of files: 1GB, 100MB, 10MB, 1MB (Set of 5x 1GB, 40x 100MB, 100x 10MB, 100x 1MB ~ 10GB)
For the 1GB and 10MB files tests, each individual file transfer time was recorded as the disk was filled in its entirety. For the “Mix of Files” test the time for the entire folder (~ 10GB) was measured.
The idea behind the 1GB and 10MB full disk file write is to check both small file and large file performance. These files are written non stop to the SSD so it is a pretty brutal test, but it should show the actual performance of the SSD NAND once any kind of caching, whether DRAM or SLC or other is used up.
The mixed file write test will write 10 sets of 10GB for ~ 100GB written, and then pauses writes for 10 minutes to allow time for any kind of caching to catch up, and then continued up to the full capacity of the SSD. This is intended to be a more accelerated “real world” use scenario. Users usually write in small to big chunks, not to the entire disk at once.
1GB Write
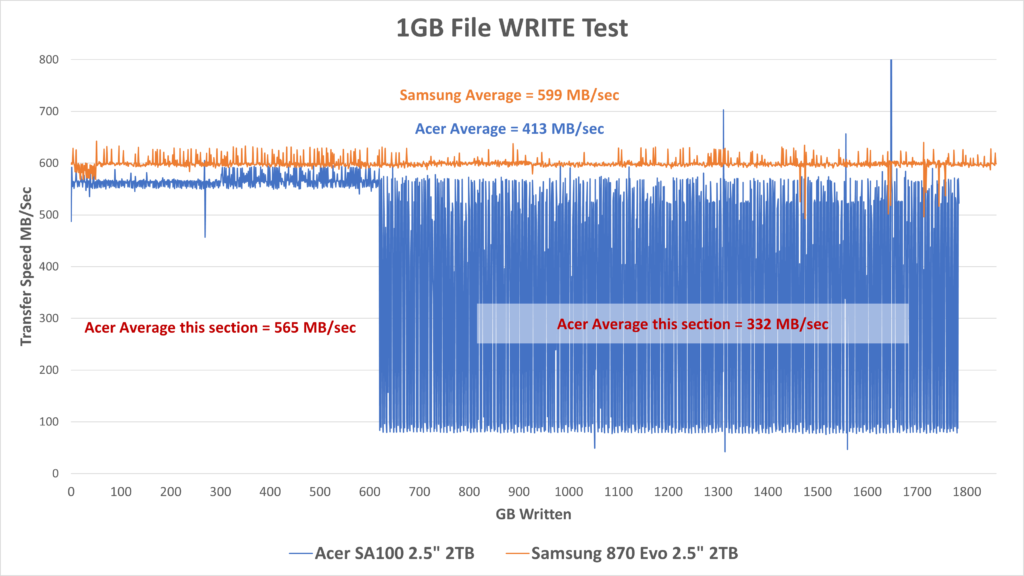
So in an actual “write to disk” scenario on an NTFS partition using 1GB files of random data you can see that the Samsung holds consistent throughout the entirety of the disk with an average of 599 MB/sec. The Acer on the other hand holds well through the first 600GB at about 565 MB/sec average. But then 600GB and up you can see a lot of performance bouncing around. The average after 600GB was aobut 332MB/sec, and overall across the disk was 413 MB/sec.
I have noticed this behavior on other similar “cheap” SSD’s after about 25% full the performance suffers, although this Acer much less so than say the Leven SSD I reviewed previously which resulted in an average 35-40MB/sec after about 500-600GB filled.
1GB Read
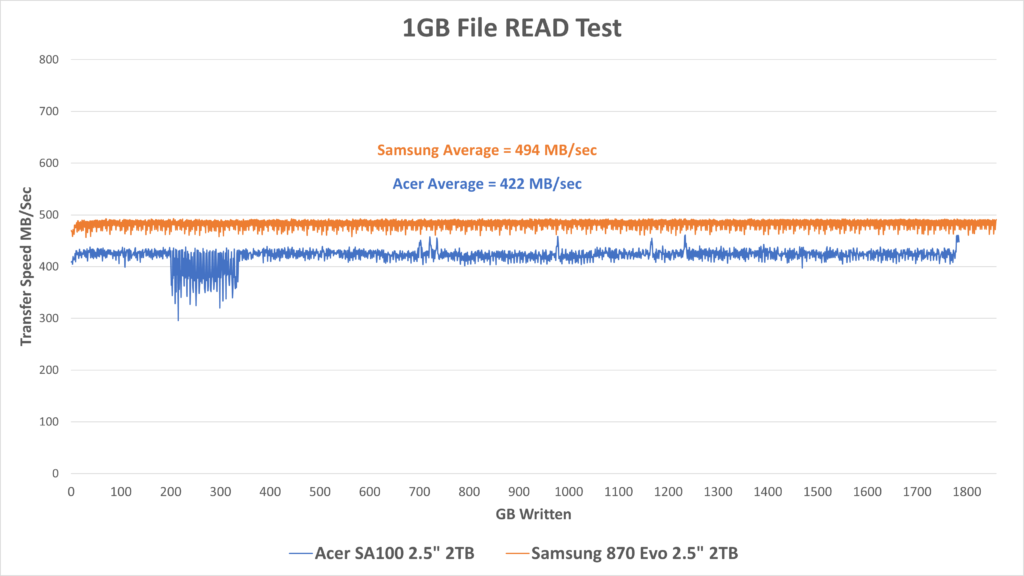
The Samsung 870 EVO maintained a consistent 494 MB/sec throughout while the Acer averaged 422 MB/sec with a slight hiccup in performance for about 100GB or so from 200-300GB of data writes. Unsure if this was an anomaly with the PC or the drive itself, but overall it fared well. It’s unclear why the write performance is so much better than read performance, however.
It is curious to see actual file copy test compared with the Hard Disk Sentinel test and how Samsung and Acer were on par on reads
10MB Write
Separate graphs are shown for Acer and Samsung SSD’s because of how much data and how much variance there is in the data, so overlaying them would not look pretty.
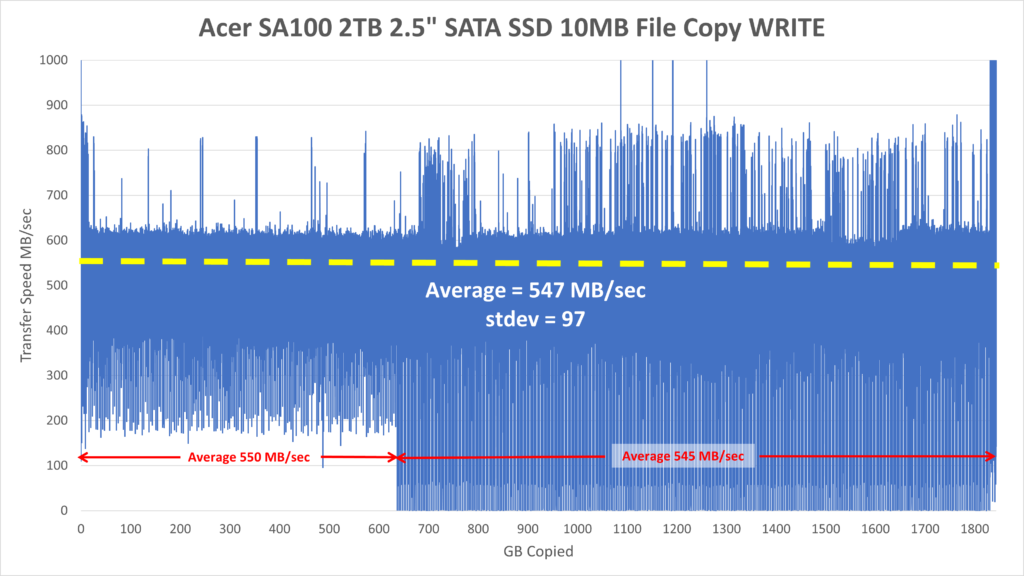
These charts look like a mess but over 1800GB of data written with 10MB file sizes means over 180 thousand files or data points. So I provided the average and standard deviation of the numbers to hopefully make it more understandable. Part of this fluctuation is likely due to Windows caching. I could run the test without cache enabled, but I don’t think that would be representative of a real work usage condition, considering write-cache is usually enabled on Windows machines.
Overall the average performance is quite good at 547 MB/sec however with a standard deviation of 97. Again, similar to the 1GB file test, after about 600GB written the performance starts to dip, or at least fluctuate a lot more dropping to as low as 1-2MB/sec periodically. But you can see that the average write speed in that section is still 545 MB/sec compared to 550MB/sec in the first 600GB of files written, so there those occasional performance drops are not too substantial.
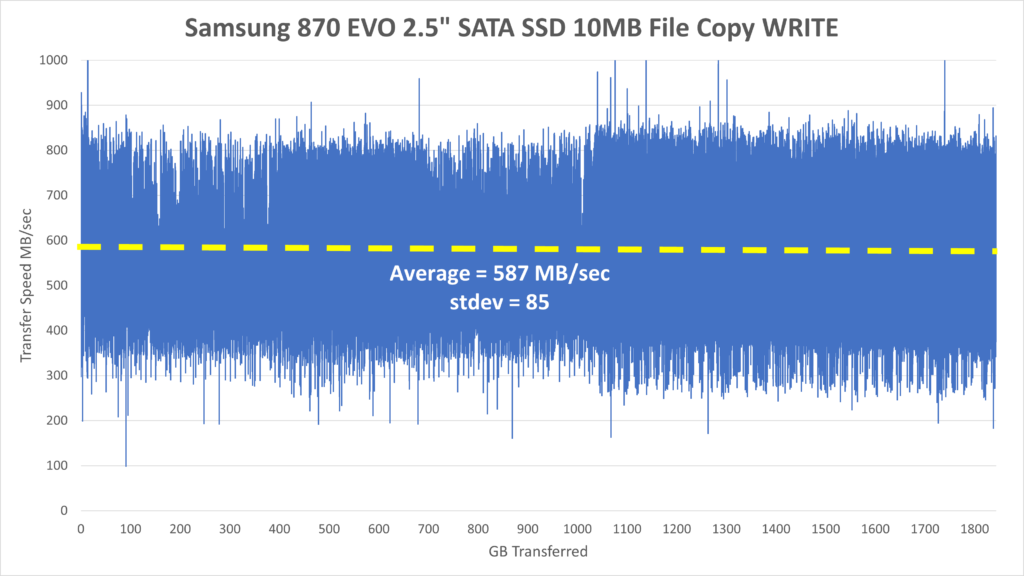
The Samsung SSD was more consistent throughout the test with a slightly faster average write speed of 587 MB/sec and standard deviation of 85. It’s range was overall between 300-800 MB/sec. Those higher values indicate to me there is some level of Windows caching going on because SATA III is only capable of max theoretical 600 MB/sec.
10MB Read
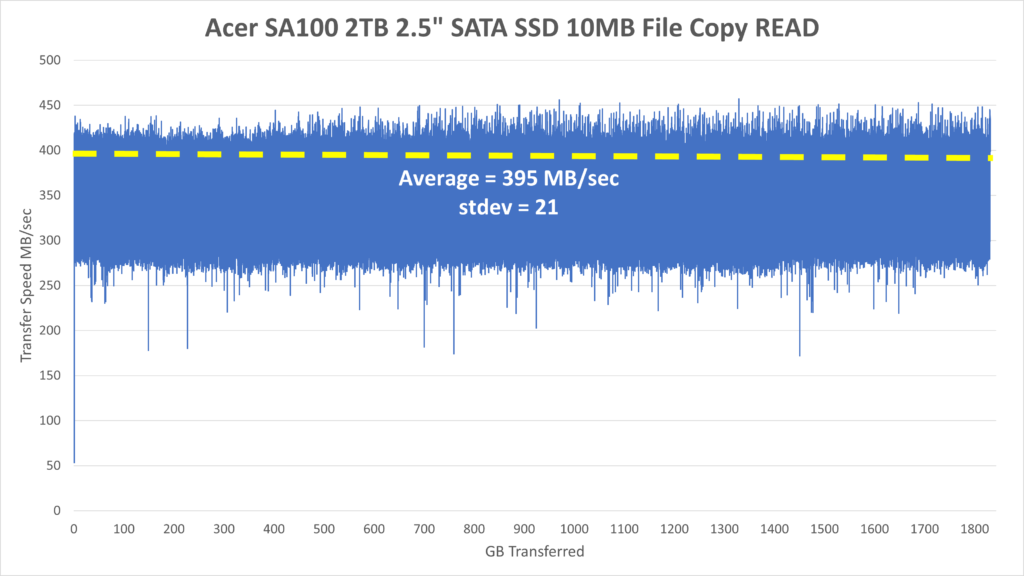
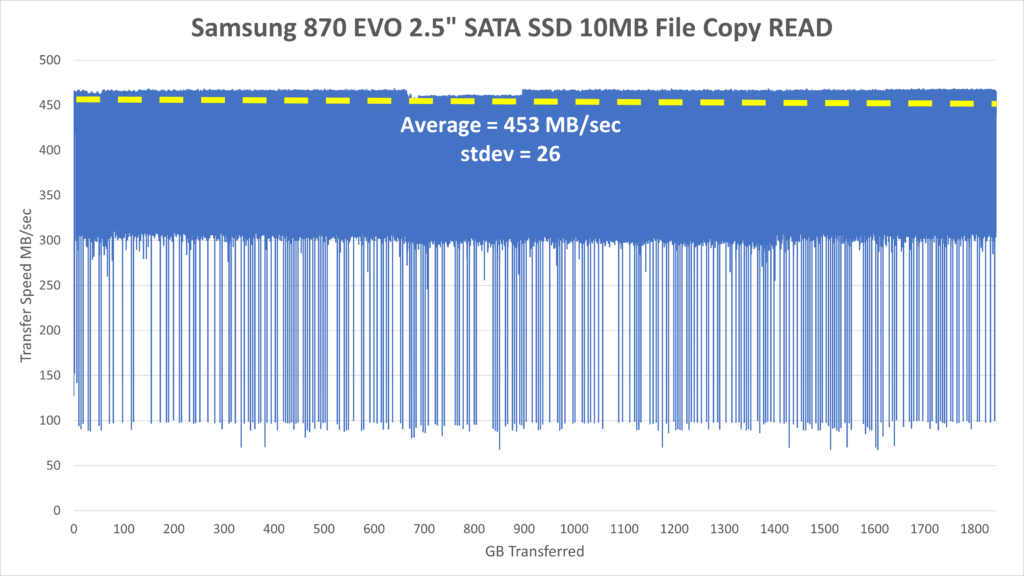
Reading back the 10MB files showed some interesting results. Overall, read performance is less than write performance by about 100 MB/sec. I have no explanation for this other than potentially Windows Defender scanning all incoming files, as I have run into this in the past, although this has not been substantiated yet. In any case this file copy test is indicative of real world performance, at least on a Windows machine.
The Acer SA100 resulted in an average of 395 MB/sec with standard deviation of 21, while the Samsung was average of 453 MB/sec with standard deviation of 26. Oddly the Samsung has some periodic dips down to 100MB sec whereas the Acer more or less ranges from 275-450 MB/sec.
Mixed File Sizes
The Mixed File Size test generates a folder of files containing 1GB, 100MB, 10MB, 1MB files filled with random data stored in a RAMdisk. RAM disk is used to ensure that write performance is not a bottleneck from another SSD:
The set of files consists of:
* 5x 1GB
* 40x 100MB
* 100x 10MB
* 100x 1MB
For a total of ~ 10GB. This folder of files using a PowerShell script is copied to the test SSD from RAMDisk (Radeon RAMDisk). Ten of these folders, total of about 100GB, are copied to the SSD before it gets a 10 minute idle time, and then the process repeats until the entire SSD is near full (in this case 180x 10GB folders). The idle time is to give the SSD time to recover, write out any cache, or do whatever maintenance it needs to do. Doing a full write the SSD can be a brutal and unrealistic test. This is still pretty aggressive, but at least it gives a more realistic sense of performance in real world.
The time to copy the entire folder contents is recorded and results are shown below. Remember every 100GB the system idles for ten minutes before continuing to write another 100GB.
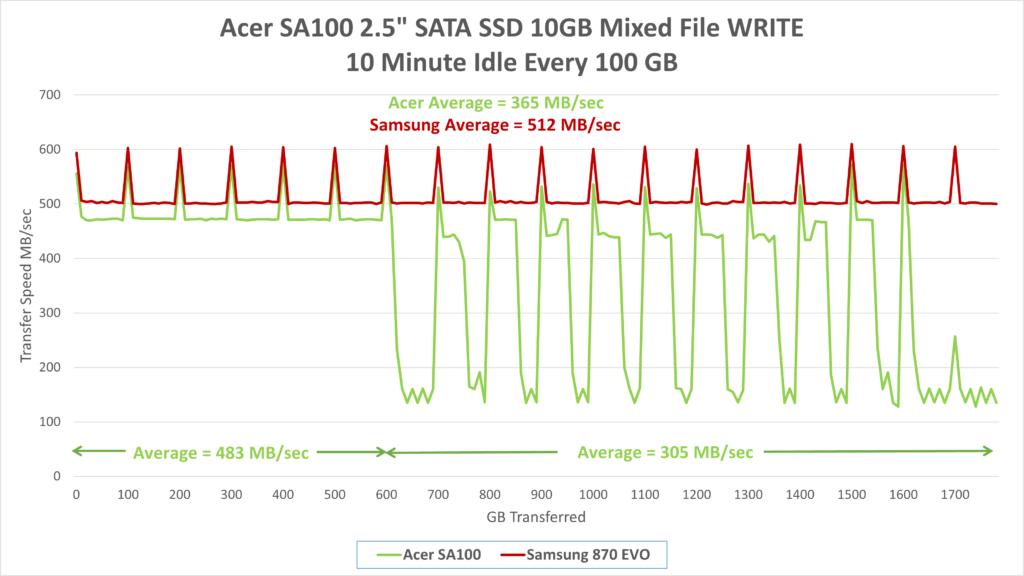
In this instance every 100GB the test pauses for 10 minutes and then starts up again. You can see the spikes to about 600 MB/sec due to caching then drops down to actual NAND performance.
But more importantly, from these results it can be seen that the drive still struggles with write performance after 600GB has been written to the drive. Even when given 10 minutes of idle time every 100GB writes for any cache or wear leveling to take place. It looks like it should be able to handle 40-50GB of file writes before it tanks down to about 150 MB/sec.
Realistically for most users this should be fine except for the rare occasions where you need to dump hundreds of GB of data to the drive.
Dynamic SLC Cache?
Out of curiosity I re-ran the mixed file size test to test a theory. It is possible to dynamically use QLC or TLC as SLC or MLC NAND. This would improve overall write performance at the expense of less storage. I figured perhaps some of the NAND was dynamically used as SLC or MLC NAND as a type of cache, and then during idle time it would shuffle that data off to QLC, relinquishing available free space. The more full a drive becomes, the less SLC/MLC cache that would become available.
Since the first 600GB of data writes seemed to perform fine, I decided to run a test by doing a 600GB mixed write test, letting the system idle for four hours, and then continue with another 600GB, idle for four hours, then write another 600GB. This idle time should hopefully allow enough time for the SSD to do what it needs to do to convert/shuffle the data off to QLC NAND.
Here are the results:
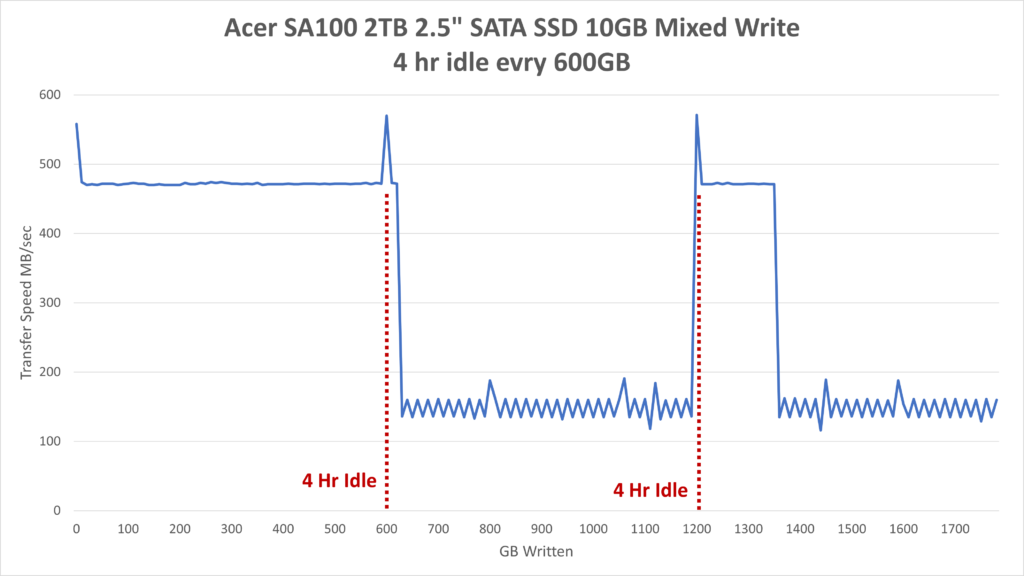
This result is a head scratcher. After 600GB even with ample idle time (4 hrs) the performance did not seem to recover at all. After 1200GB written and another 4 hrs idle time performance was more or less regained for about 130GB or and then tanked down to about 150MB/sec. This is substantially better than the Leven SSD that was reviewed previously which would dive down to about 30MB/sec, so better, but still a bit disappointing.
Perhaps with more idle time it will recover completely, maybe a test for another day.
CONCLUSION
For under $100 the Acer SA100 2.5″ 2TB SATA SSD is a great bargain. It does suffer a bit after capacity has been filled beyond 600GB of data. Whether this performance will be restored after ample idle time (beyond 4 hrs) is inconclusive. Otherwise based on testing, one can expect a see-saw of performance between about 425MB/sec and 150MB/sec after the first 600GB of data has been written to the drive.
Read performance generally is good running about 425MB/sec sequential large file, 395MB/sec for smaller file sizes of 10MB, and based on ATTO pretty much maintains that of all file sizes 8K and larger.
During a full disk write, temperatures ran upwards of 52C but tended to idle around 40C and writes it didn’t exceed 45C with reads without any active cooling.
For light usage the Acer SA100 2TB SATA SSD seems to operate nearly on par with the Samsung 870 Evo. But any kind of heavy usage performance can falter. This would make a great drive if used primarily for read operation like for Steam games or streaming movies. But if you need a heavy write usage, I’d consider something else.
Thanks for another great post.